Test your water for microplastics in 15 minutes.
The world’s first in-home microplastics kit. Test your tap, your filter, bottled water, even your tea. Particles that take up the stain glow bright pink under the digital microscope. You count them yourself in minutes.
Tests sold separately · results in 15 minutes
We make the invisible visible.
Your tap looks clean. Bottled water looks clean. Your filter looks like it is working. Looking tells you nothing. The test gives you a real particle count.
The kit indicates suspected microplastics — particles big enough to catch on a filter. The nanoplastics travel with them: smaller, invisible, and roughly 90% of the plastic in bottled water. A high count is your signal that both are there.
Some filters work. Some do not. You cannot tell by looking.
Real tests · Los Angeles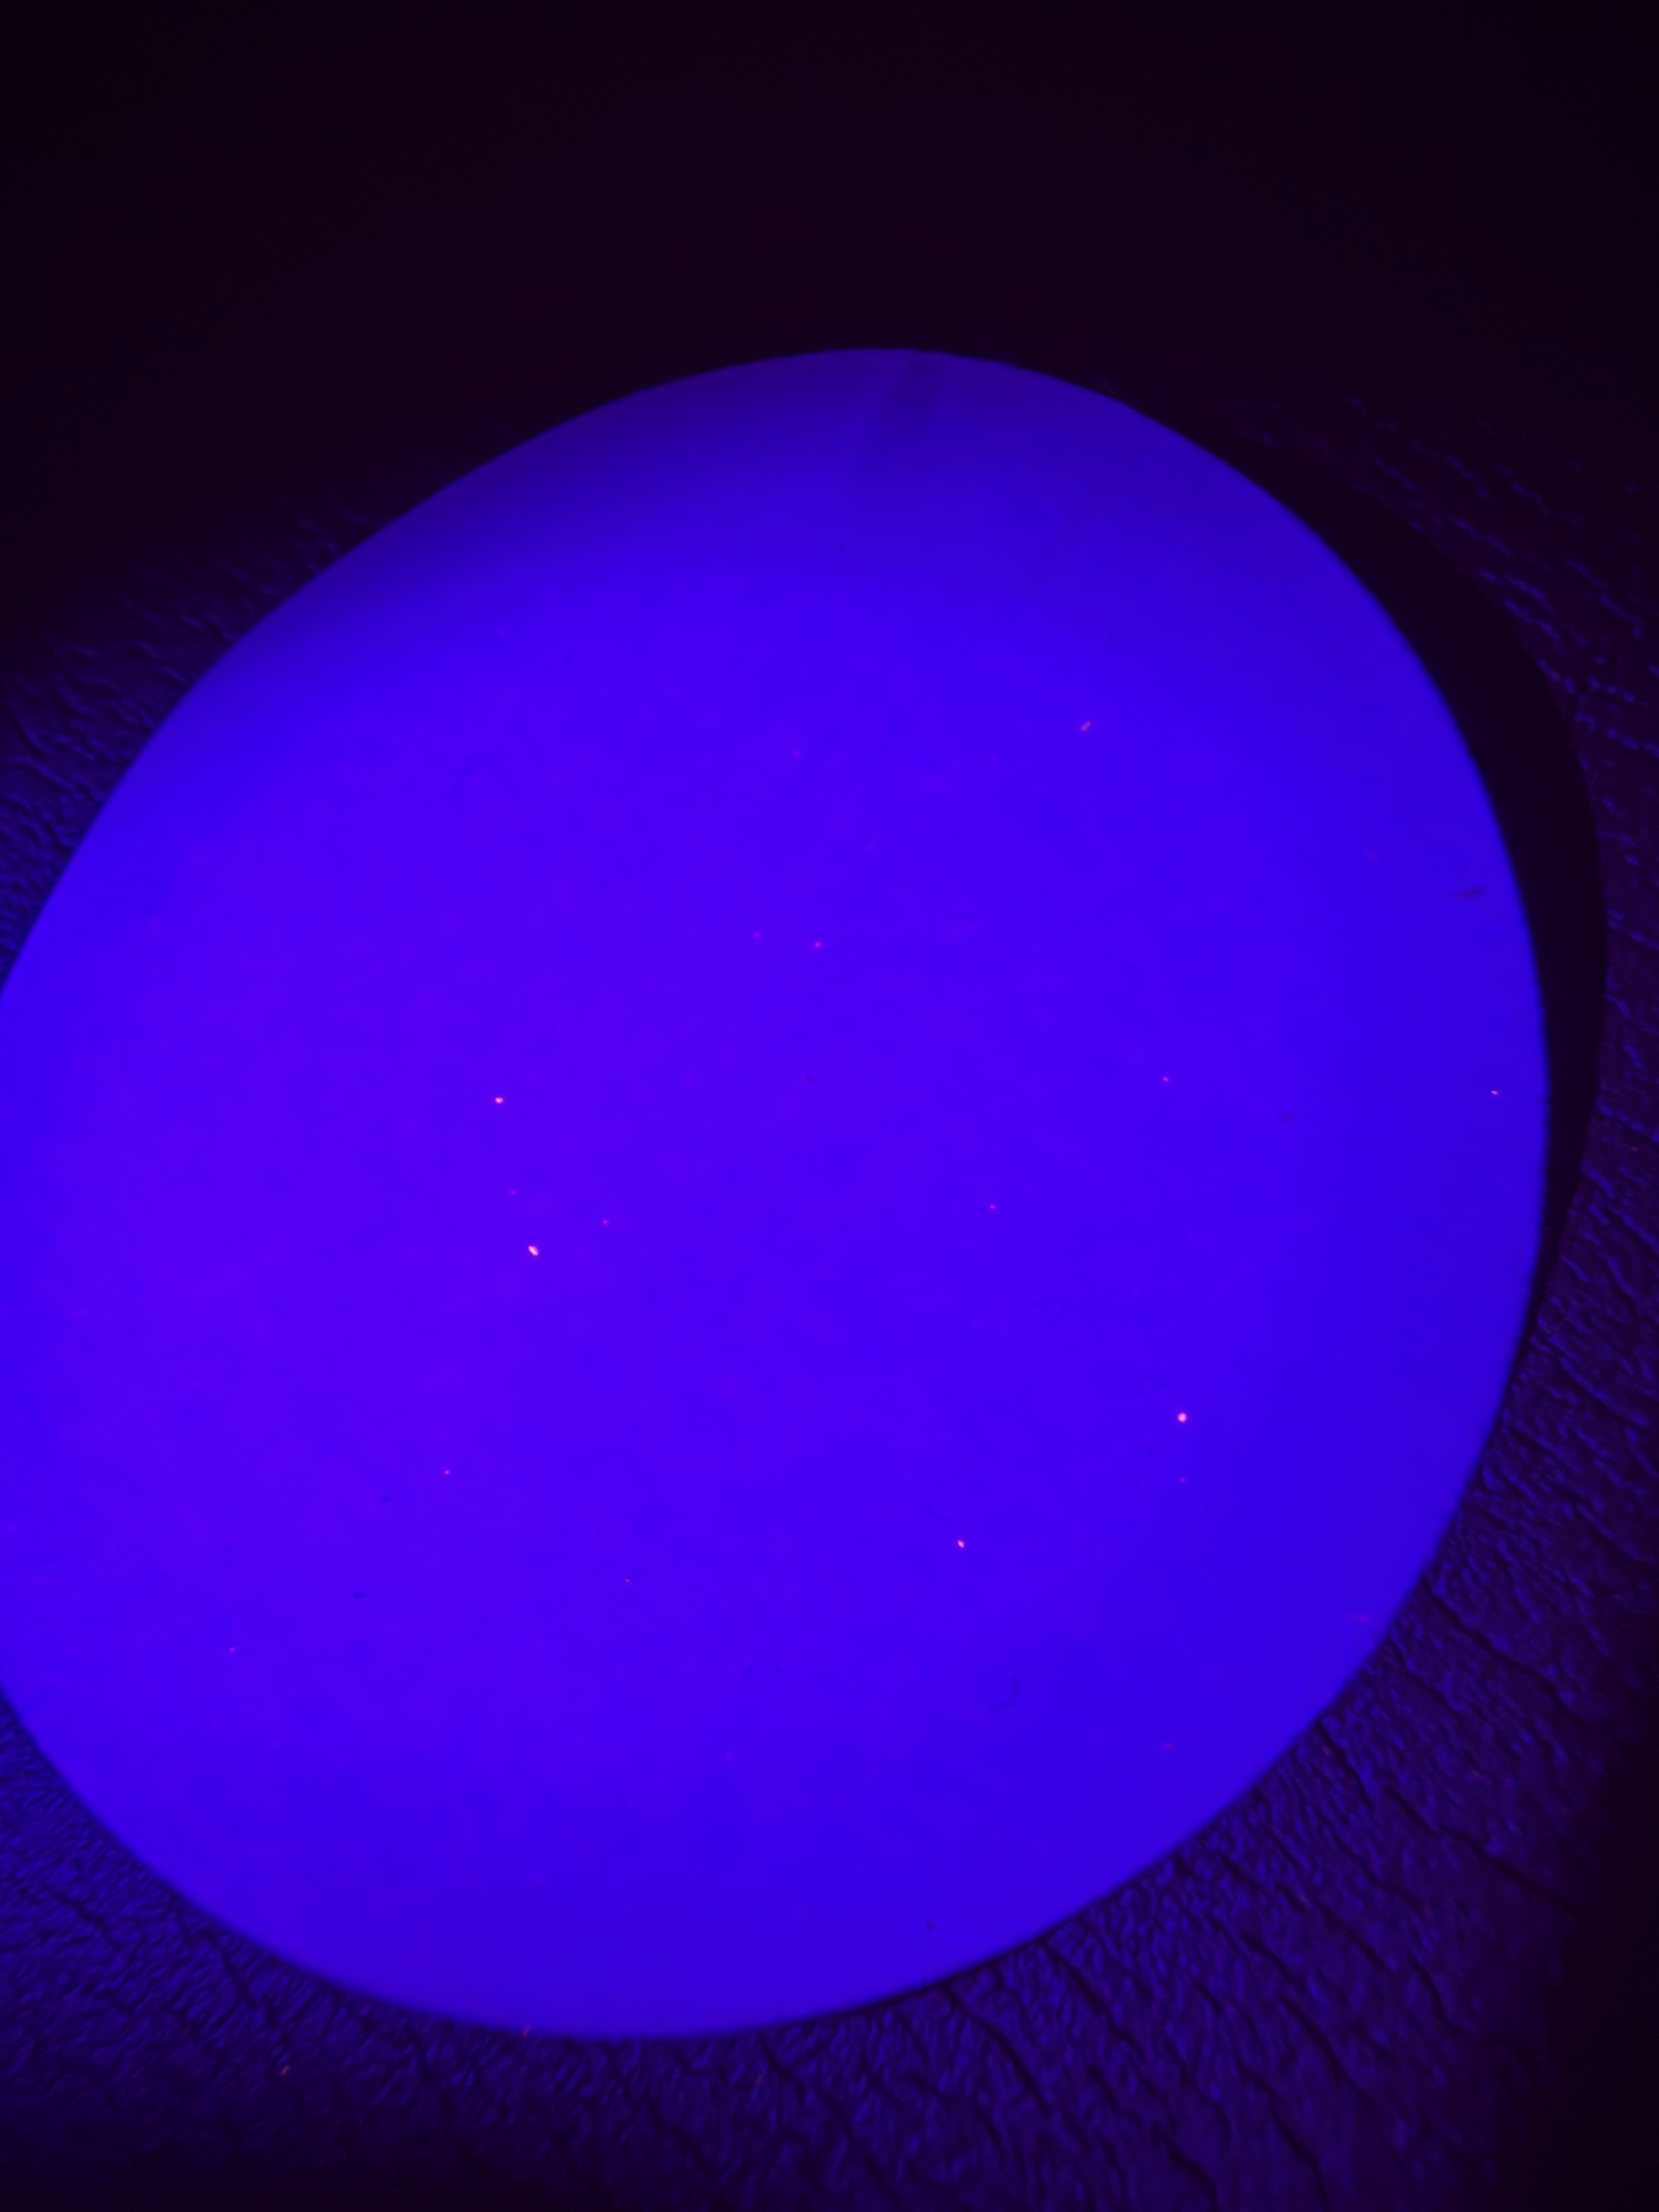
Own a Berkey, ZeroWater, Brita, or RO system? Find out if it actually removes microplastics.
Pick two things to test
Your tap and your filter. Bottled water and tap. Tea, formula, your gym bottle. Whatever you are curious about.
Run the kit
Add the stain, push the water through the filter, look at the filter under the digital microscope.
Read the result
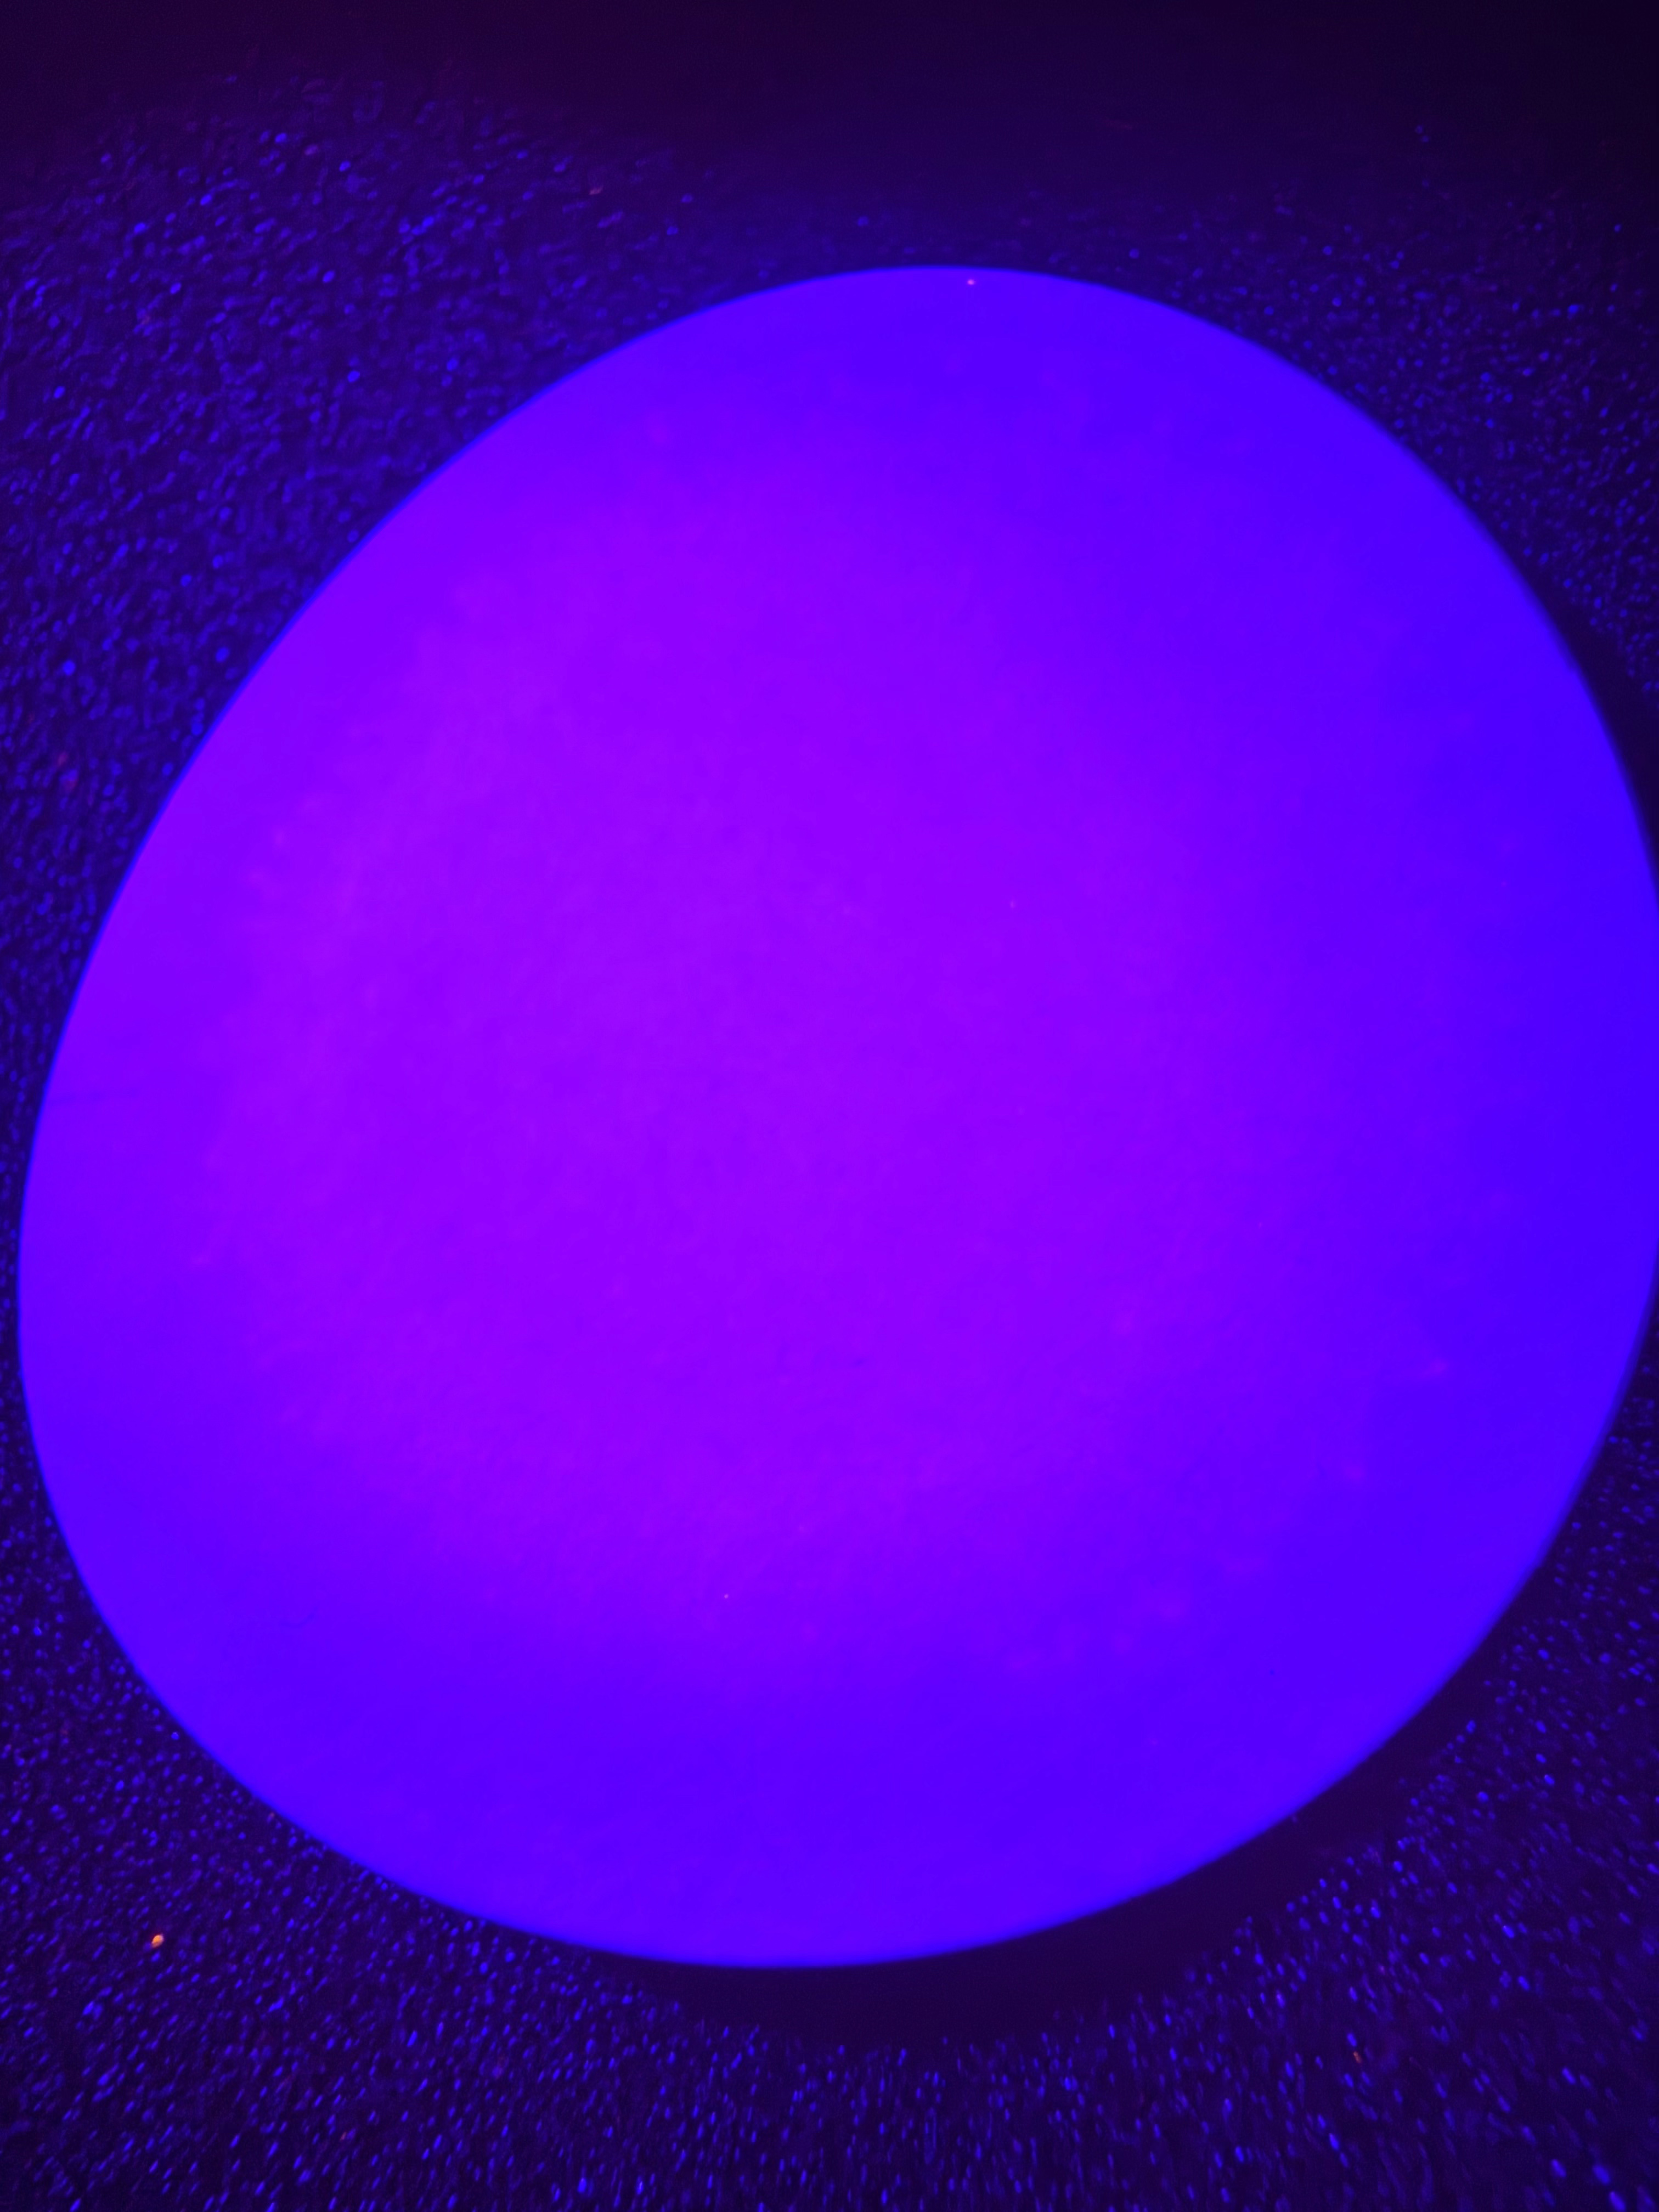
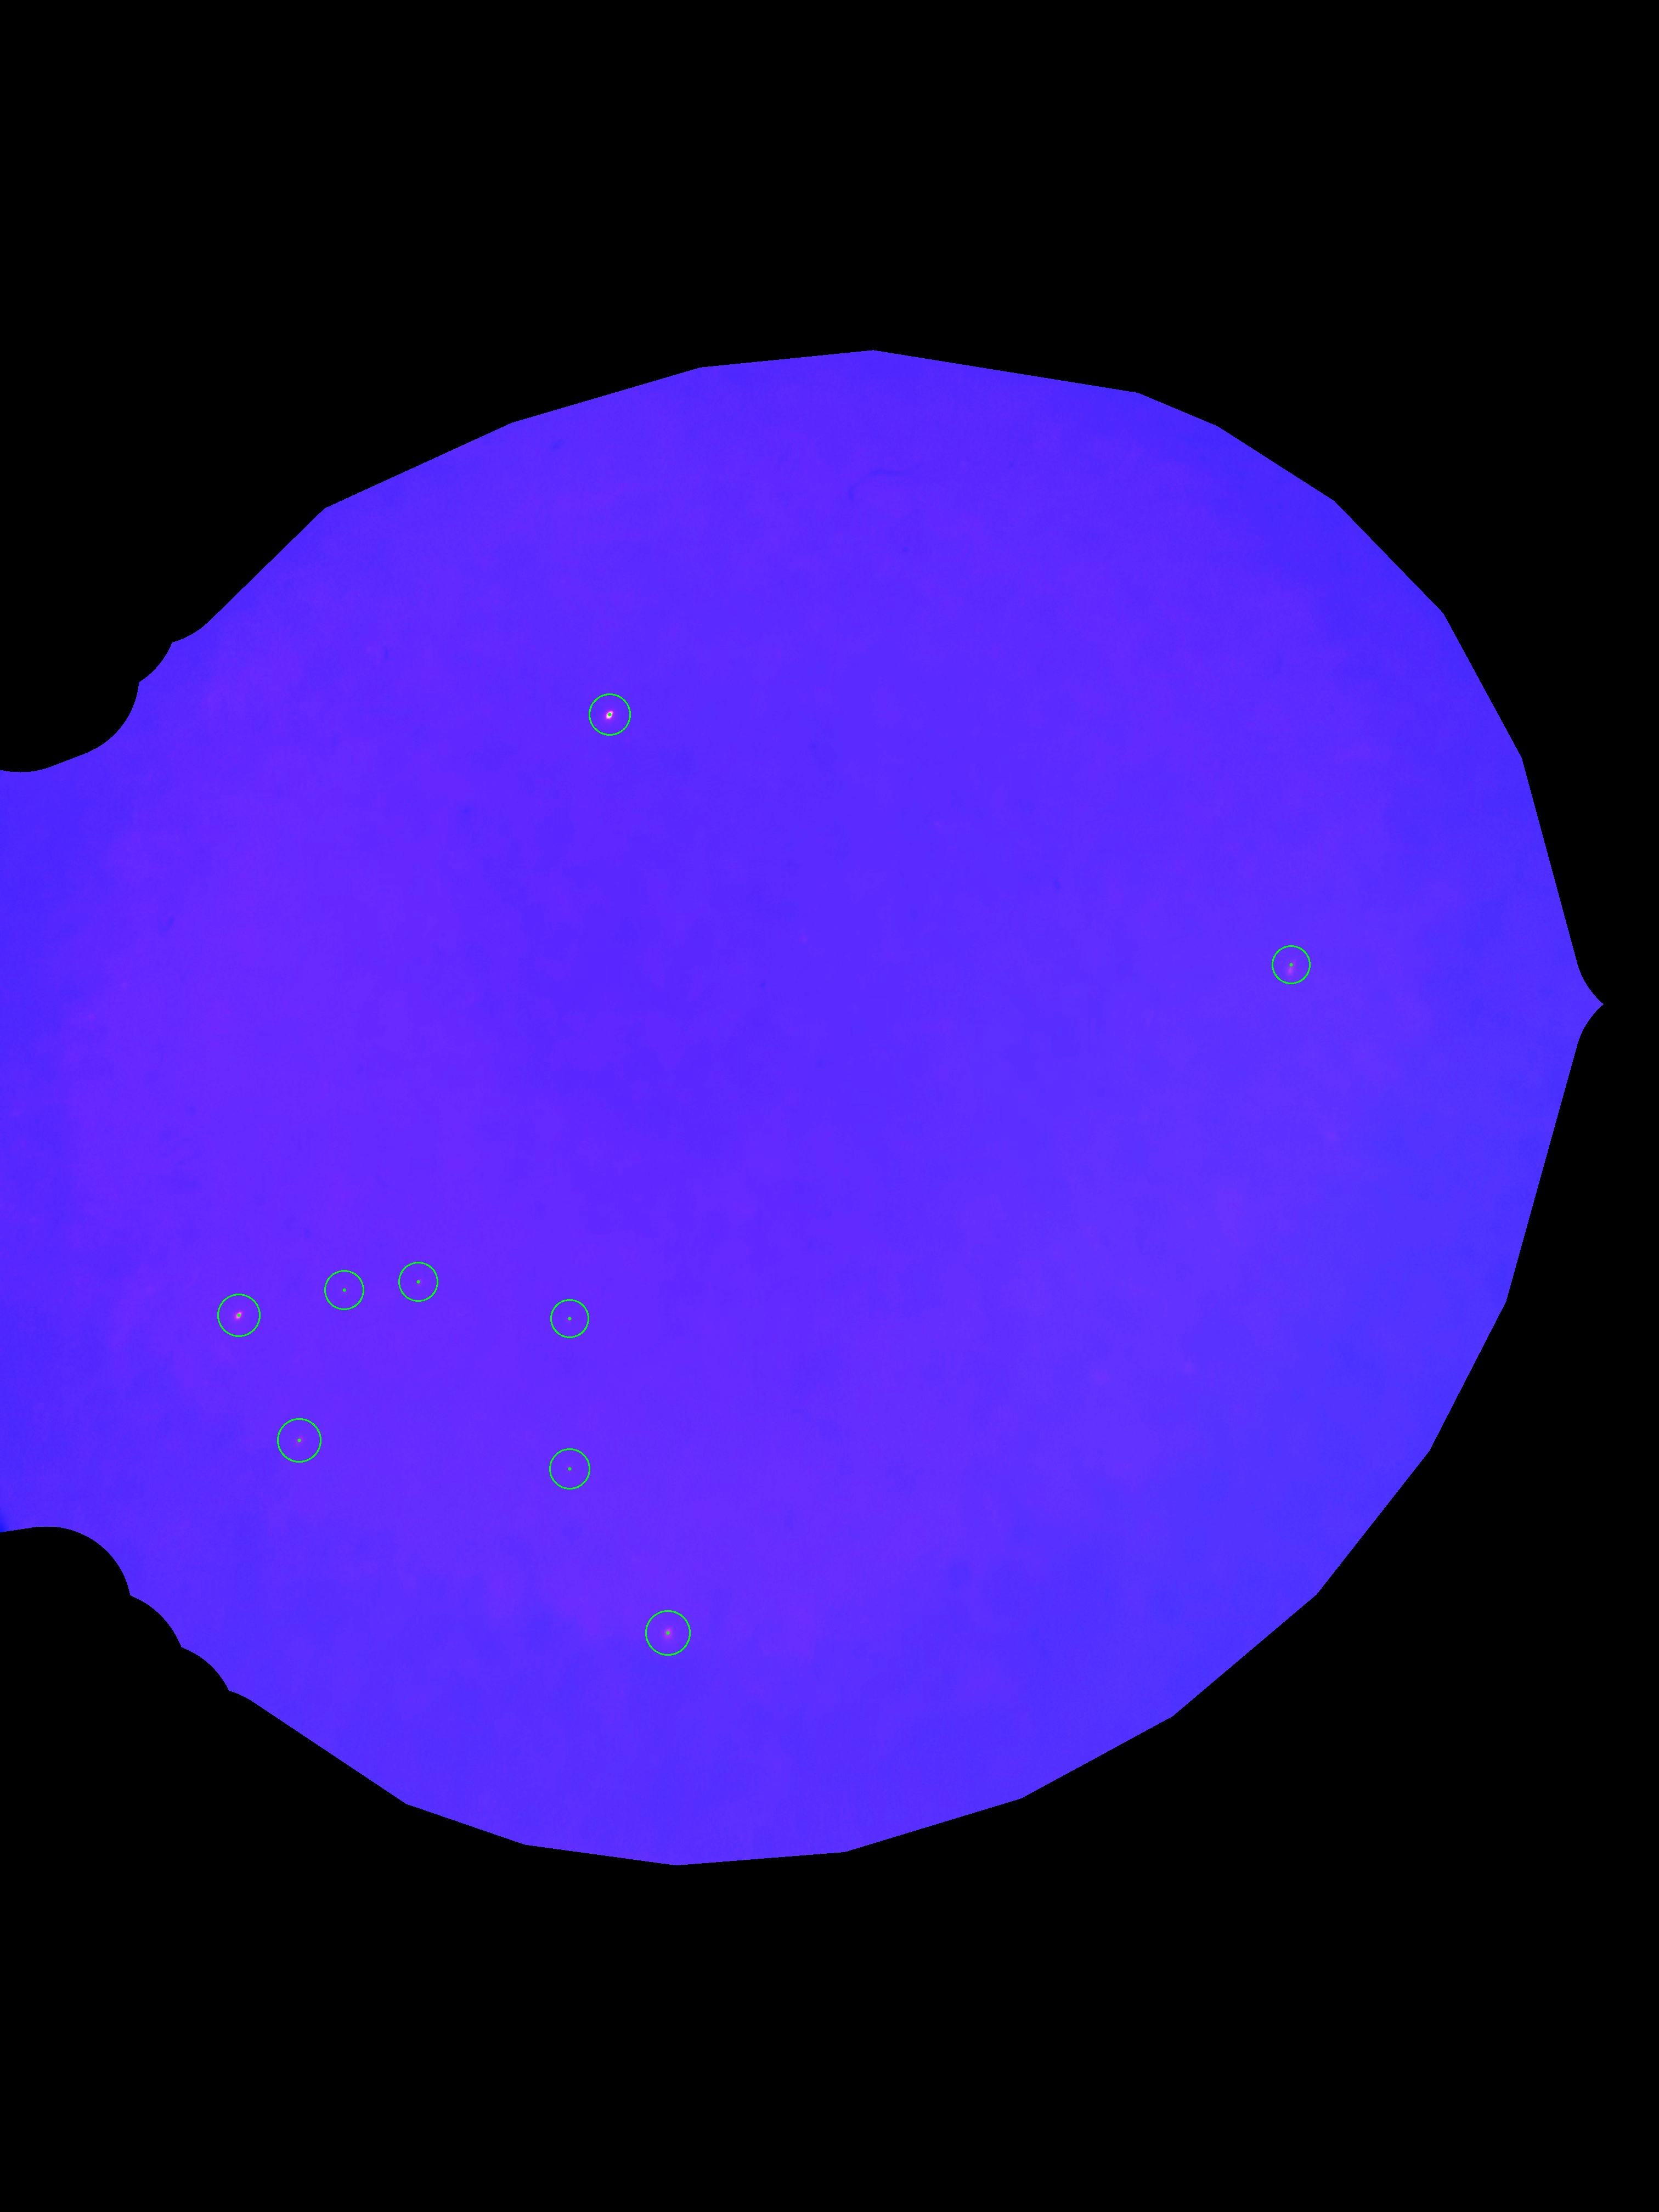
Pink dots indicate particles that took up the stain. You count them yourself under the microscope.
The Water Test kit
Tests sold separately
No lab. No $600 bill. No waiting weeks. You run it in the home and see the count yourself.
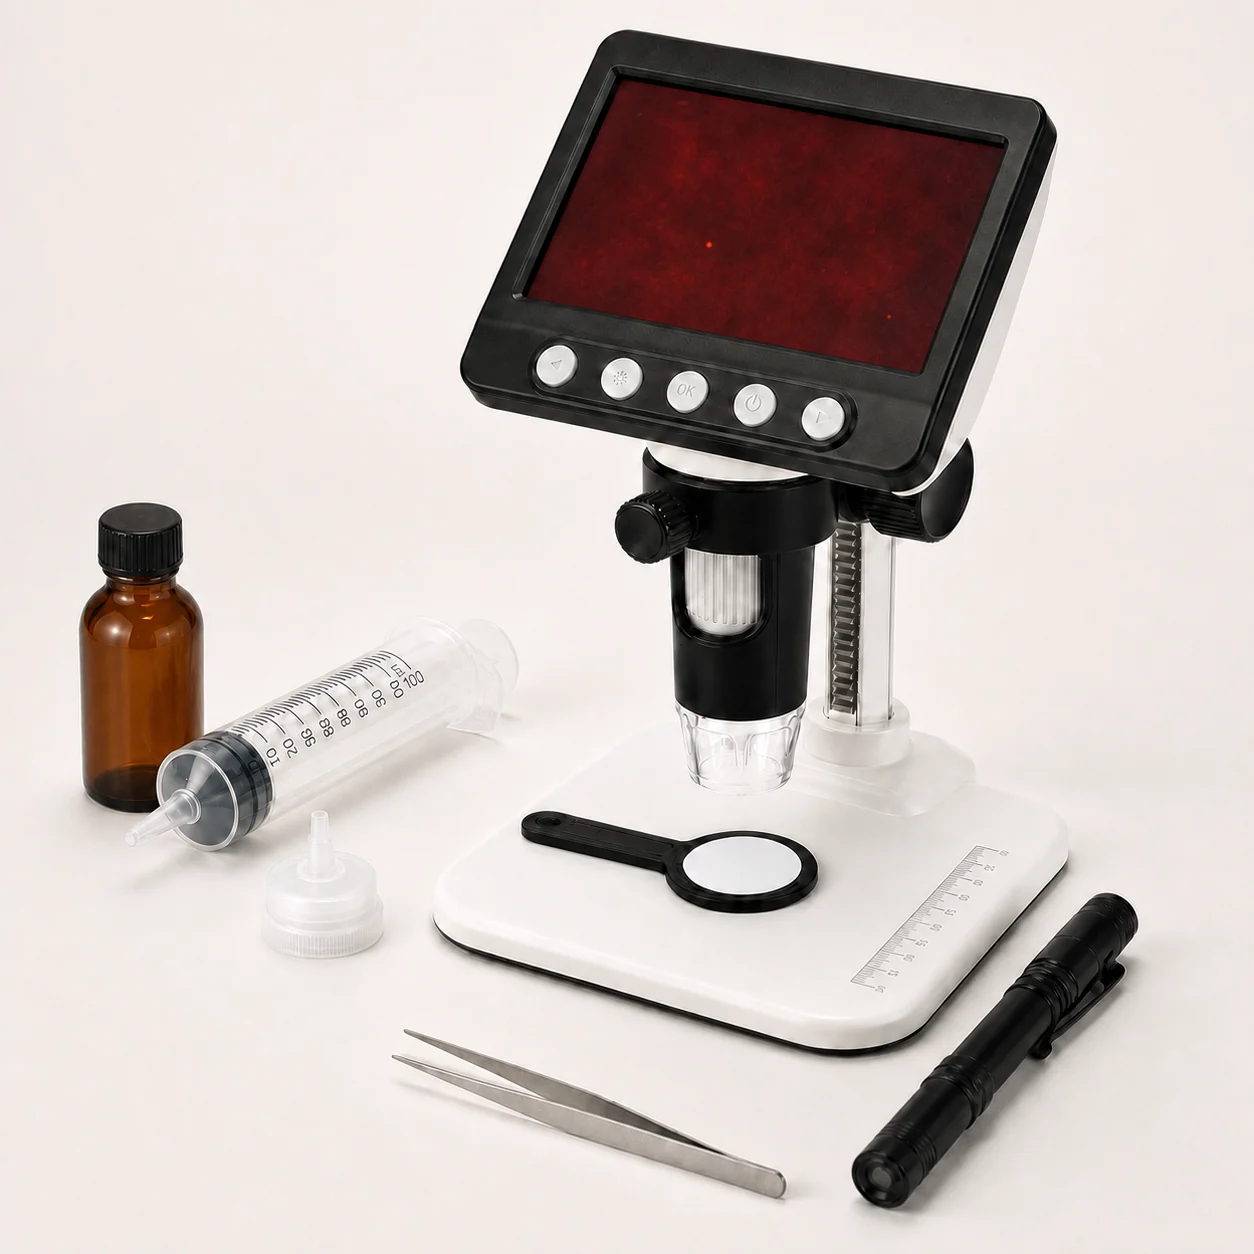
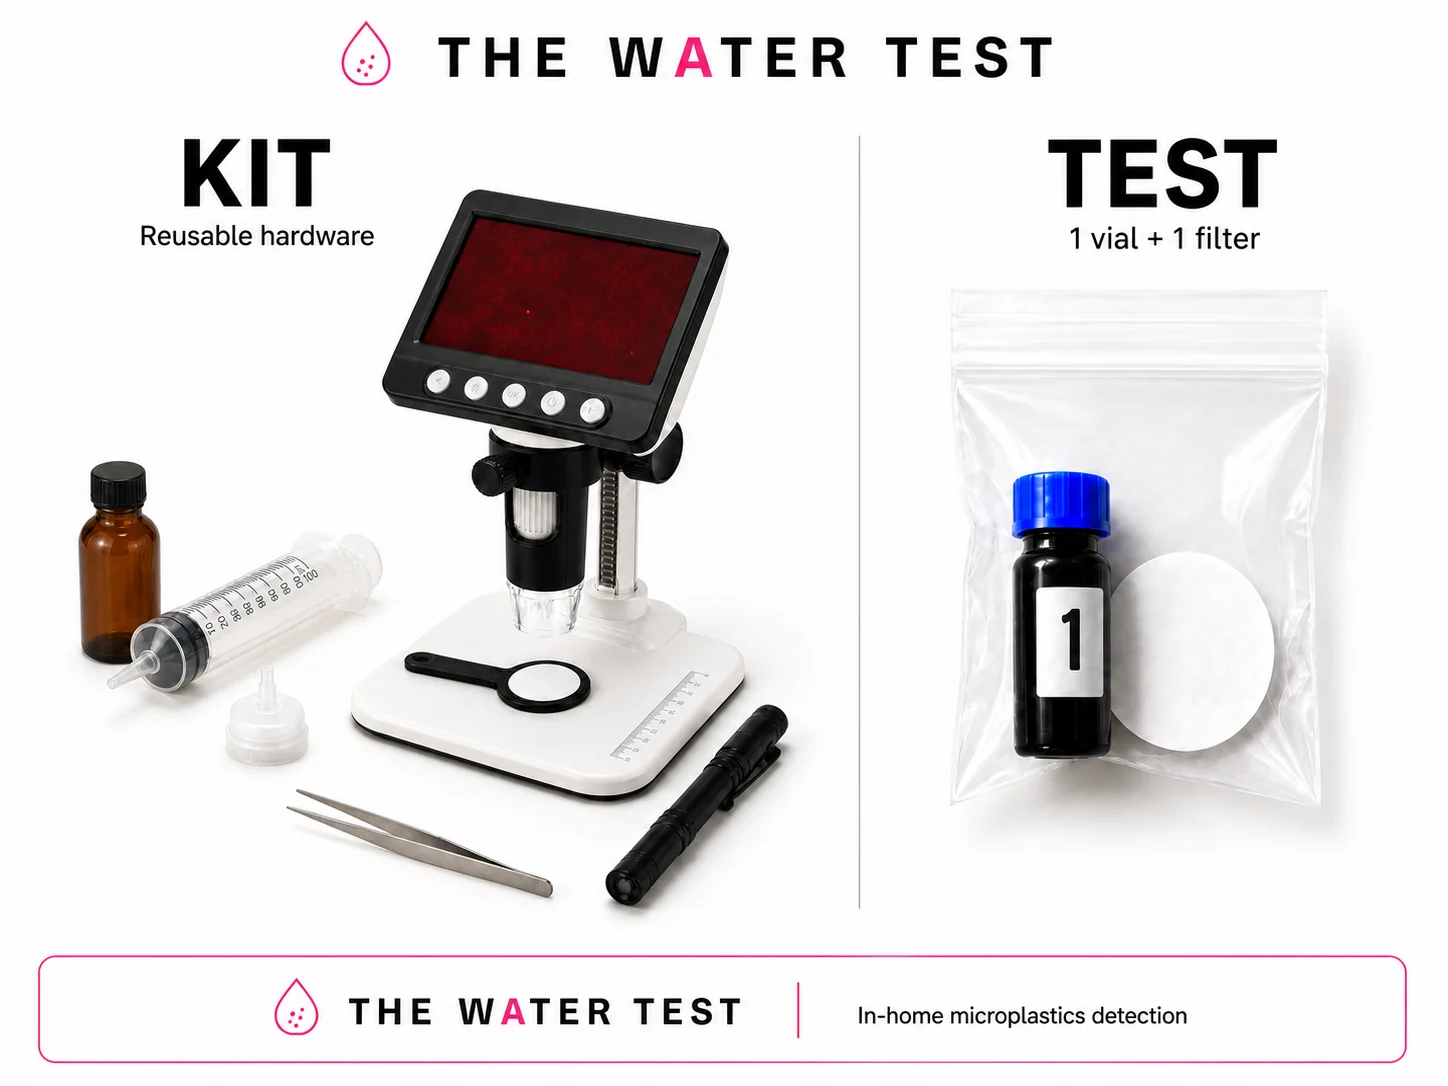
- Tabletop digital microscope with built-in screen
- Syringe and membrane filter holder
- Wand, flashlight, and tweezers
- Step-by-step instructions
- See and count the particles yourself
The kit is the equipment. The test is what gets used up.
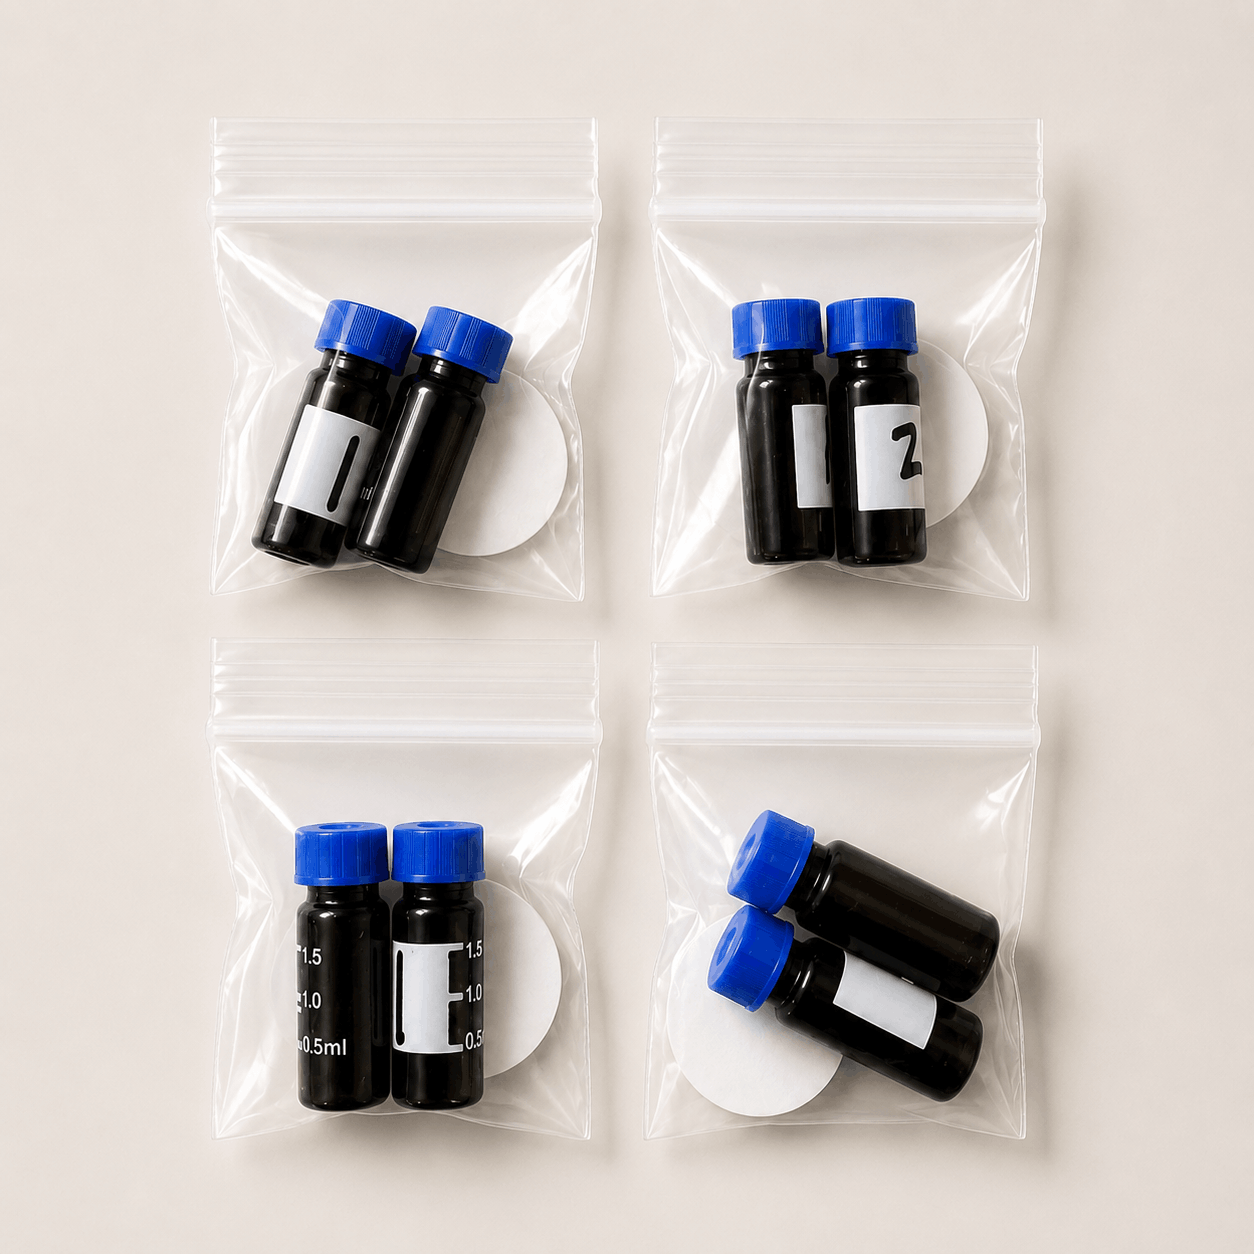
You buy the kit once — tabletop digital microscope, syringe, membrane filter holder, wand, flashlight, and tweezers. It comes with zero tests. A test is one staining vial plus one filter, and one sample uses up one test. Order one test for every sample you want to run.
“New baby, kept stressing about making formula with tap water. Tested the tap and our Brita. The Brita came back a lot cleaner, so that is what we use now.”
“Had an under-sink filter for years and just trusted it. Tested the tap and filtered side. Filtered came back way cleaner. Good to know.”
“Tested our tap next to the bottled water we buy by the case. Figured the bottled would be cleaner. It was not.”
“Our tap came back basically clean. Hardly any pink dots. I was expecting the opposite.”
Follow along
See what we are finding each week.
New filter results, particle counts, and photos worth seeing. No spam.
No spam. Unsubscribe anytime.
Everything on microplastics and nanoplastics, in one place.
The microplastics test kit
How the in-home kit works, what it detects, and what it costs.
In-home vs. lab testing
Cost, speed, and accuracy — and when a $600 lab is actually worth it.
Filters & bottled water, tested
Does your filter remove microplastics? What's in Fiji, Dasani, Aquafina?
Microplastics in the body
What research shows about microplastics in blood, urine, and stool.
Nanoplastics vs microplastics
The smaller half you can't see — about 90% of the plastic particles in bottled water.
How to test your water
The step-by-step in-home method, start to finish.
Field tests & experiments
Tea bags, baby formula, LA tap water — everything we've run.
Common questions
What is the difference between a kit and a test?
The kit is the reusable equipment and comes with zero tests. A test is one staining vial plus one filter, used up on one sample. Order one test per sample you want to run.
What does the kit test?
It shows plastic-like particles caught on a filter. Pink dots indicate particles that took up the stain, and you count them under the digital microscope.
Can I test my filter?
Yes. Test your tap, then test the filtered water, and compare the microplastic counts.
What if I do not have a filter yet?
Test your tap first. If you install a filter later, you will have a real before-and-after.
Does it detect nanoplastics?
No. The kit indicates suspected microplastic particles down to ~1 micron. Nanoplastics are smaller than any optical method can see and need lab instruments.
Is it hard to run?
No. If you can fill a glass and follow instructions, you can run it. About 15 minutes, start to finish.
More questions? See the full FAQ or read how it works.